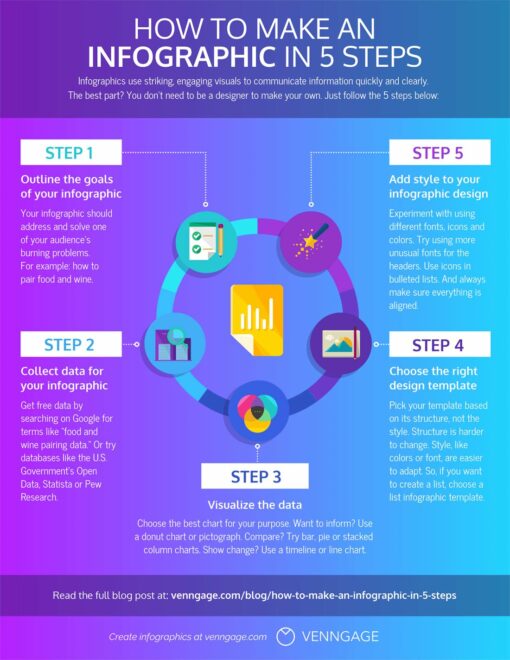
Infographics
Making infographics is a skill, it’s a combination of thoughtful concise writing and creativity – choosing how you display your information.
Creating an Infographic
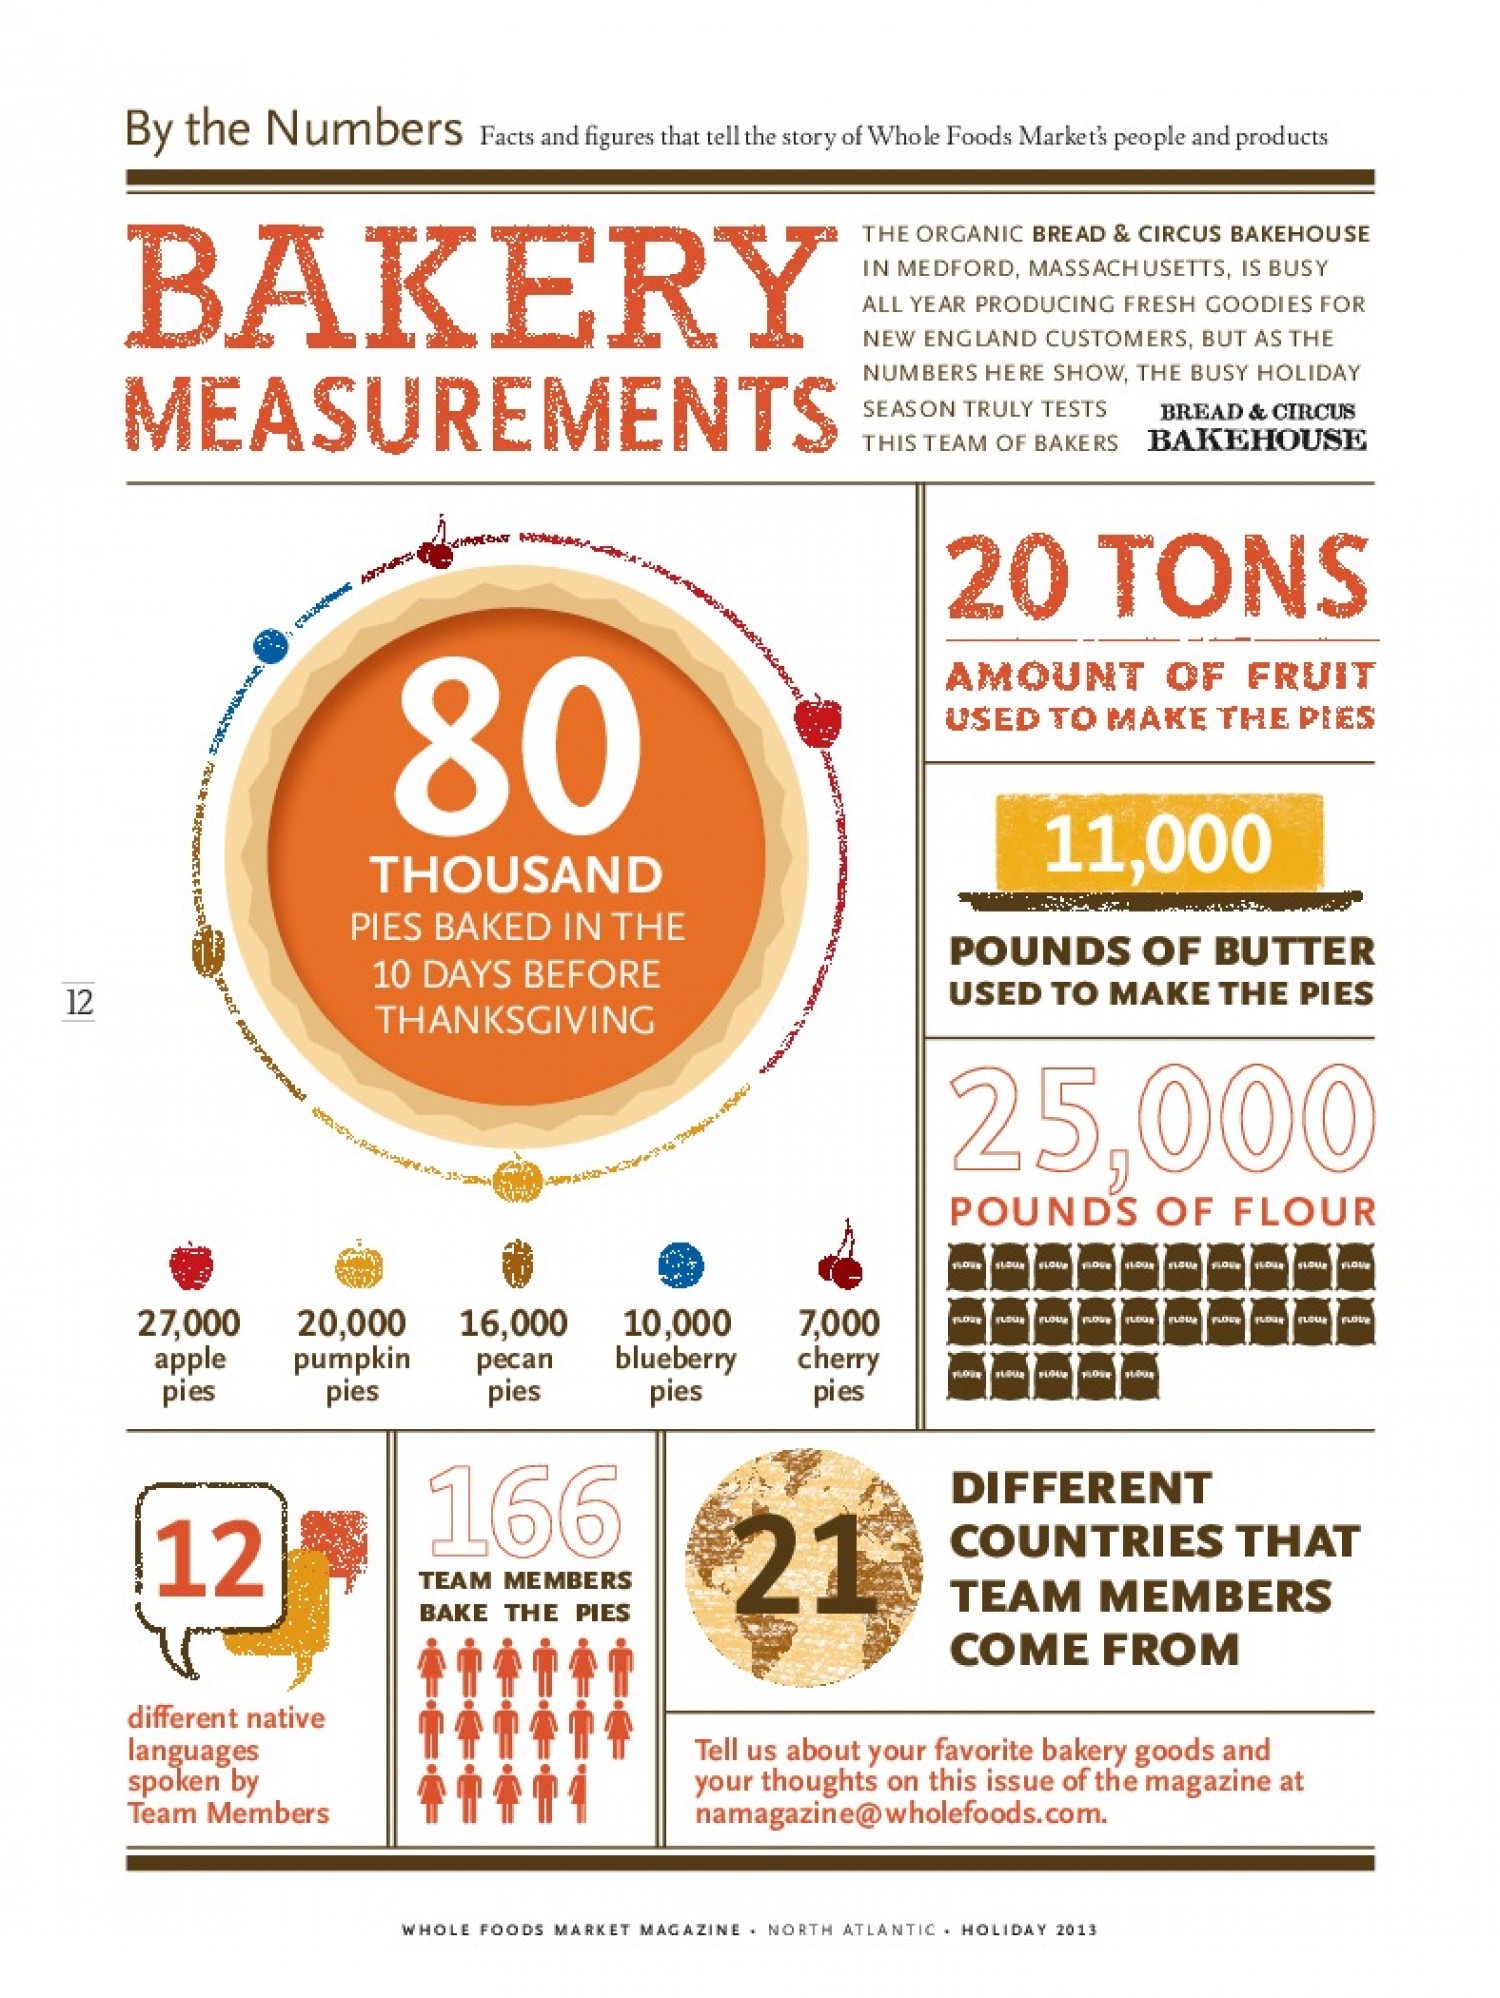
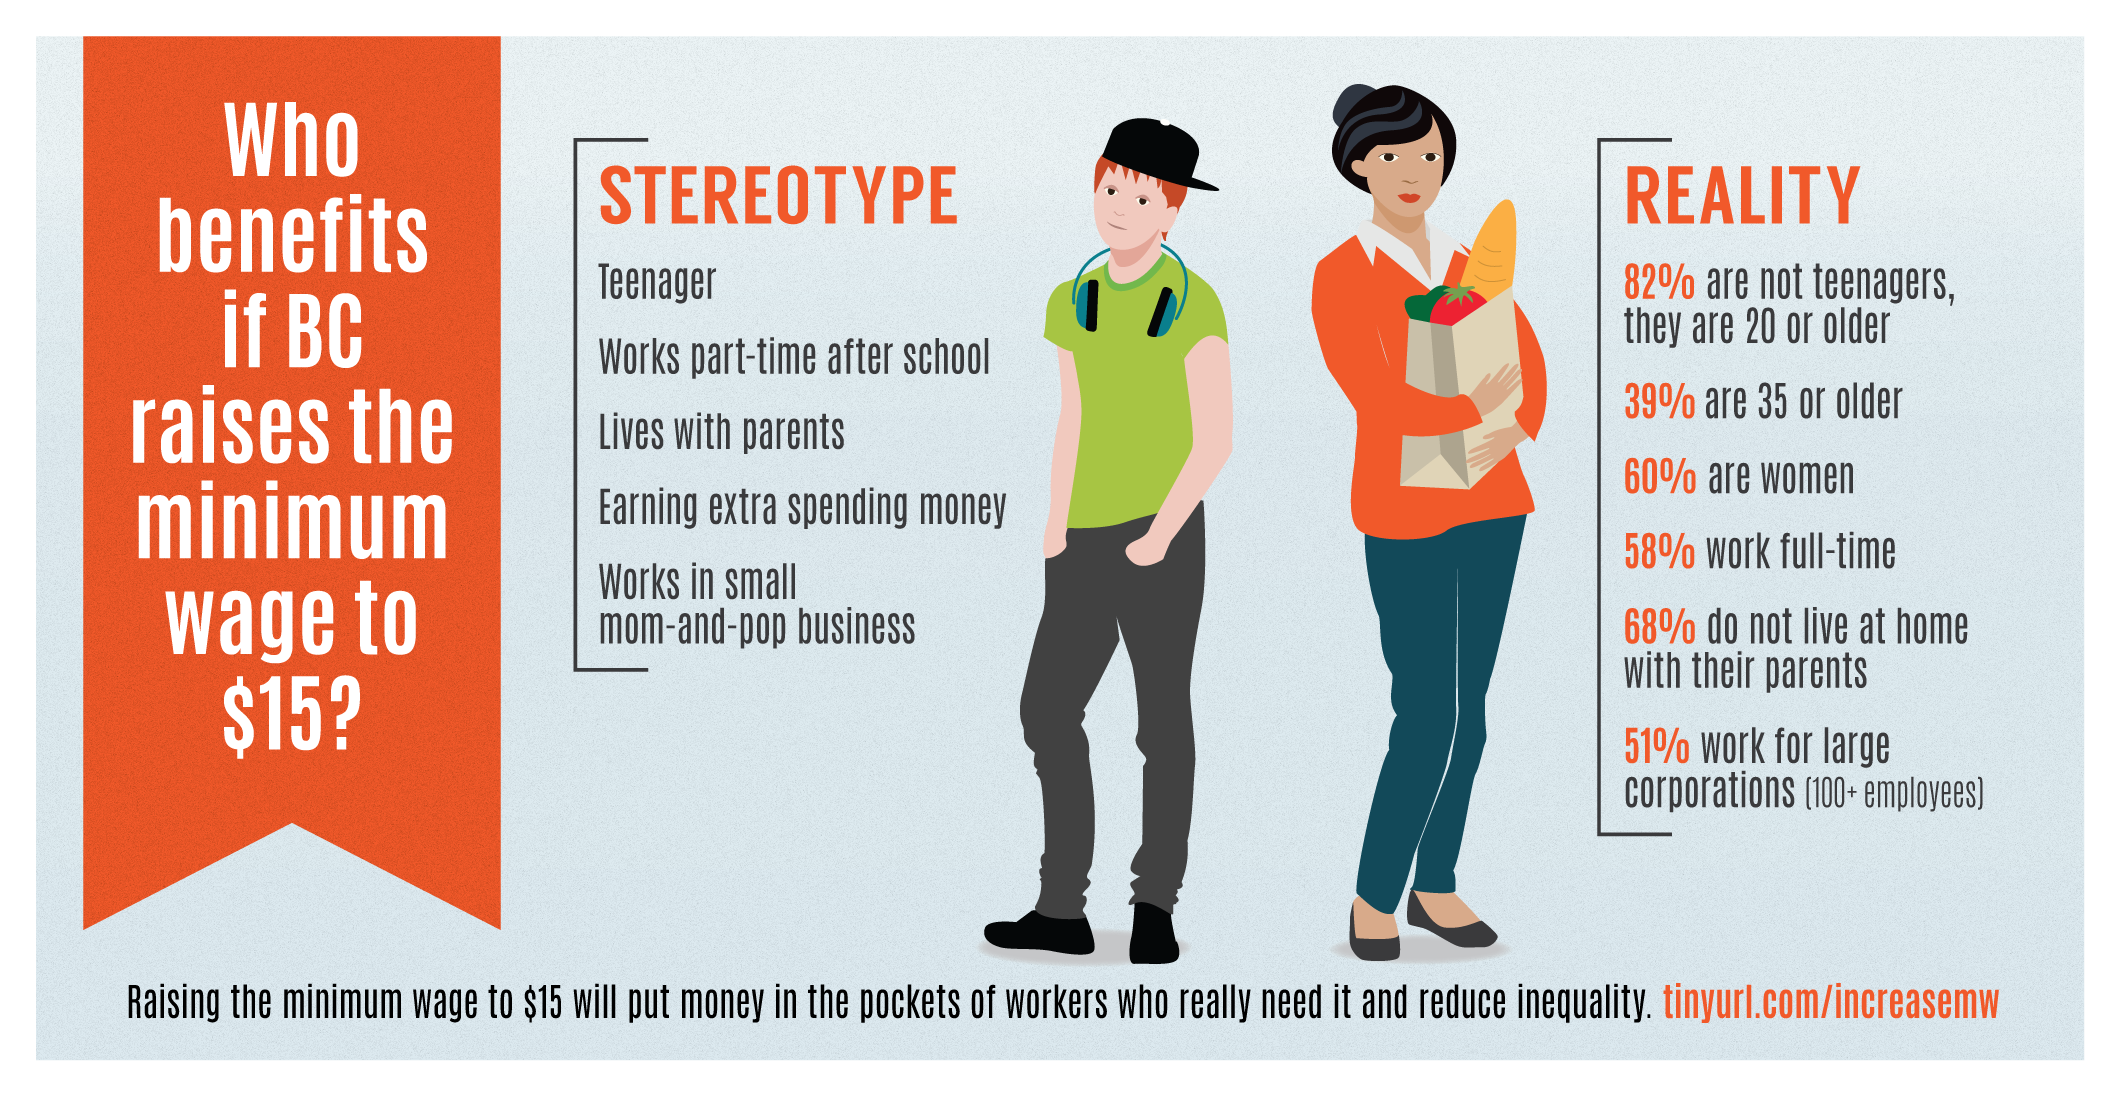
Infographics can help people understand complex concepts by using visual aids such as charts, graphs, or diagrams. They can use both images and text in a visual format to explain concepts which allows many different types of learners to understand the information. They’re often used for marketing purposes but they can be useful when writing articles or sharing research too.
In journalism, some stories are strengthened when infographics are used because they are such effective tools for packing big ideas into small spaces and they are attention grabbers. In many ways, infographics can be a story in themselves, and intriguing stories have a clear structure, focus, and purpose – your infographic should too.
Infographics can also have a large impact when it comes to brand credibility by providing information about your organization leading to transparency, causes important to your organization leading to positive brand reputation, or other information providing value to your audience. Even doing things like customizing your infographic using your company’s, organization’s, or brand’s colours helps to spread further understanding of your brand.
Research
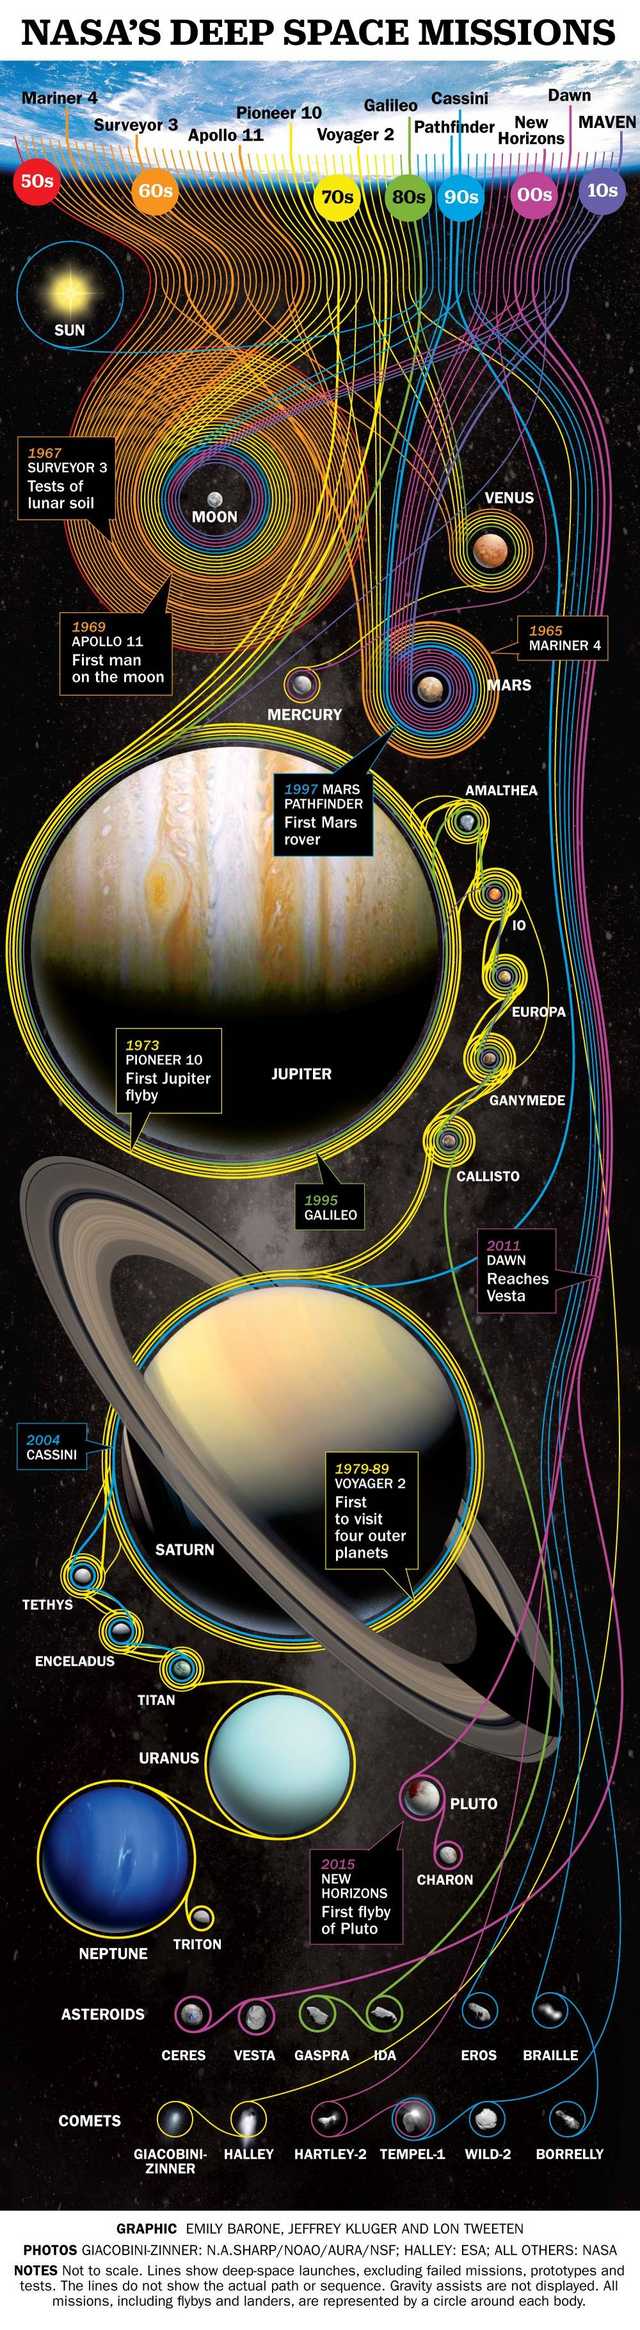
After deciding on the topic for your article and within that figuring out the goal for your infographic it’s time to jump into research. Start looking for credible tidbits of information that would sound good on their own. For examples of those take a look at other infographics or the examples below. Or if you are creating something that involves sharing data you have (like the Nasa example below) research how other experts are showing your information or the most effective ways to display your information.
Organizing Information
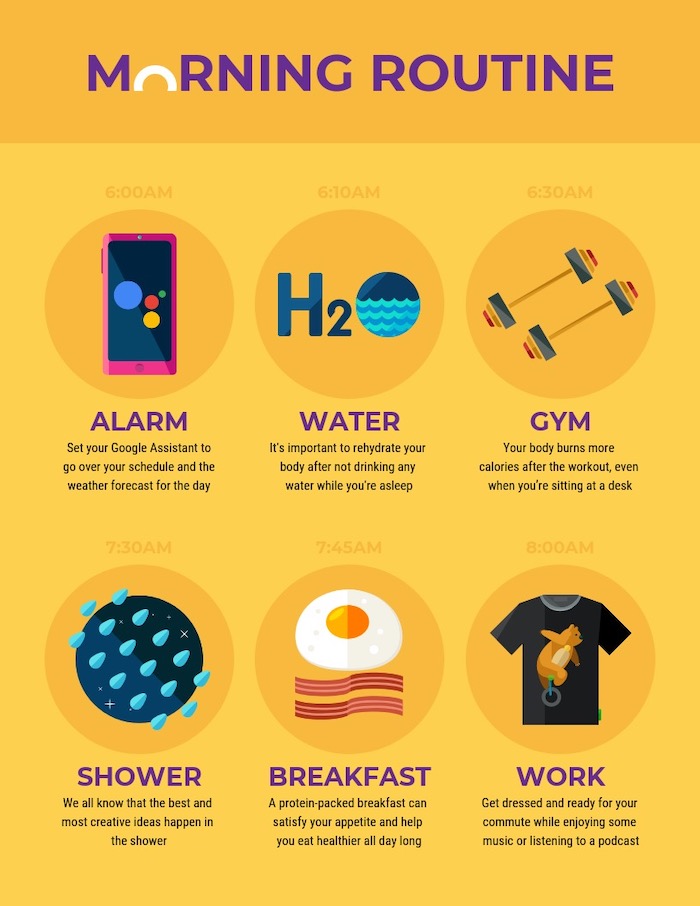
Thinking of organizing your information is a very important part of infographics. Things should be grouped together to tell a story effectively, not just random facts thrown together. Additionally, not all infographics are statistic based, so if you are using information that is word-heavy conciseness and whitespace are even more important. Take this time to think of how to visualize your data or other information
Infographic Layouts
There are so many different types of layouts and design options. It is really up to you to design something that makes sense for your information, looks nice, is logically organized, and is sharable.
Free infographic templates are available through: